
What Are Software Development KPIs?
In the world of software development, Key Performance Indicators (KPIs) play a critical role in measuring project success and driving continuous improvement. Software KPIs are essential metrics used to evaluate the effectiveness and progress of development processes, code quality, and team performance.
By tracking these KPI for software development, organizations can gain valuable insights into their projects, identify areas for enhancement, and make data-driven decisions to achieve their goals.
Implementing and analyzing these KPIs empowers teams to optimize their processes, deliver high-quality products, and stay competitive in the fast-paced software industry.
In the upcoming sections, we’ll guide you through the key KPIs to keep in mind for achieving success in your software project.
Read More: Benefits of Custom Software Development
Metrics vs KPIs
In the realm of software development, understanding the nuanced difference between metrics and Key Performance Indicators (KPIs) is important for practical software project evaluation. While these terms are often used interchangeably, they hold distinct roles in gauging performance and achieving business objectives. Metrics are quantitative measurements that provide insights into specific facets of software development, such as code complexity, team productivity, or system performance. On the other hand, KPIs are a subset of metrics strategically chosen to align with overarching business goals.
Consider metrics as the building blocks that offer granular insights into your software processes, like measuring bug count or identifying the number of errors per code line. These metrics provide essential data but don’t necessarily encompass the bigger picture. KPIs, on the other hand, are strategic software performance indicators that guide your software development efforts toward meeting broader objectives. For instance, the time it takes to resolve defects or reduce response time can be KPIs that reflect the accomplishment of your software’s strategic goals.
While every KPI is a metric, not every metric is a KPI. KPIs demand a clear link to organizational objectives and outcomes, and they represent the most crucial measures that drive progress. Metrics, meanwhile, are essential tools that contribute to your understanding of specific operational aspects.


Transform Your Ideas into Reality with Future Code’s Software Development! Partner with Future Code’s expert developers to create innovative, scalable, and robust software tailored to your business needs.
Metrics and KPIs for software quality
Now that we understand the difference between Metrics and KPIs, let’s explore some key indicators that help teams assess and improve their software’s reliability and performance.
-
Active Defects
This simple yet vital KPI allows teams to track the status of defects – whether they are new, open, or fixed but not verified. The general principle states that a lower count of functional defects corresponds to higher product quality at a given moment.
-
Escaped Defects
This metric counts the number of defects that slipped through the QA and testing process and were identified by customers after the product release. It highlights areas that need improvement in the QA practice and ensures better software quality.
-
Defect Density
This important metric helps determine the total number of defects discovered during a specific time frame, relative to the size of the software module. By counting defects per thousand lines of code (KLOC), teams can decide whether the software is ready for release or requires further testing.
-
Defect Severity
This metric assesses the impact of defects on software development or operations. Defect Severity Index (DSI) provides insights into the software’s quality and helps evaluate the test team’s efforts in maintaining high performance. The formula for Defect Severity Index is:
Defect Severity Index (DSI) = Sum of (Defect * Severity Level) / Total number of defects.
-
Defect Turnaround Time
The defect turnaround time refers to the duration from when the defect was initially reported to the moment it is fixed. This KPI enables teams to identify areas for improvement and assess the efficiency of team members in resolving issues.
-
Automated Tests
Implementing automated tests helps catch critical defects introduced during software delivery. This KPI aids in ensuring that crucial aspects of the software are thoroughly tested, reducing potential risks.
-
Test Coverage
This metric determines the extent to which the software’s functionality is covered by testing.In simpler words, it’s a method to ensure that your tests effectively examine your code, or the extent to which your code is exercised by the tests you run.The Test Coverage Formula involves these steps:
-
- Determine the total lines of code within the targeted software quality undergoing testing.
- Count the number of lines of code that all the current test cases cover.
Subsequently, you calculate (number of total lines of code/ number of lines of code that all the tests cover) multiplied by 100. The outcome of this computation represents your test coverage percentage.
-
Mean Time to Resolution (MTTR)
MTTR measures the time spent on resolving software issues. Keeping MTTR at the lowest possible number helps in increasing software quality, as it minimizes downtime and revenue loss.
Transform Your Ideas into Reality with Future Code’s Software Development! Partner with Future Code’s expert developers to create innovative, scalable, and robust software tailored to your business needs.
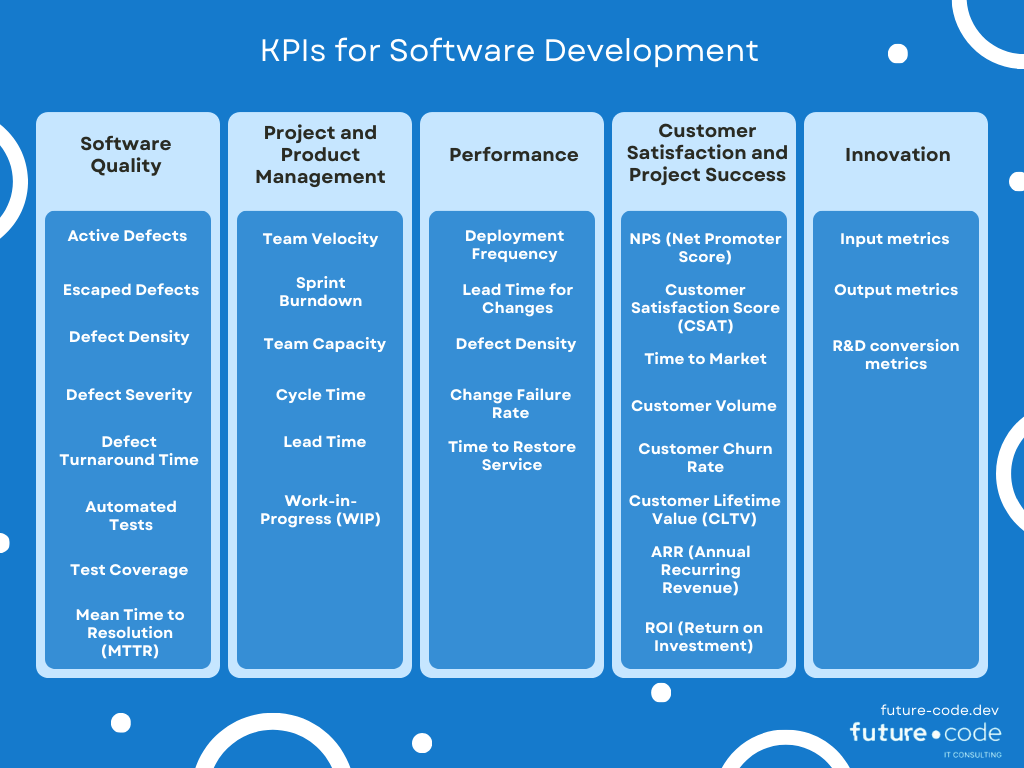
Metrics and KPIs for project and product management
Metrics and Key Performance Indicators (KPIs) are indispensable tools for effective project and product management, providing valuable insights into team performance and project progress. Let’s explore some KPIs that can supercharge your development process metrics and drive successful outcomes.
-
Team Velocity
This KPI measures the amount of work a development team can complete in a single sprint. It helps gauge the team’s productivity and allows for better estimation of project timelines. Team velocity can be measured using various units, with story points being the most common. While it offers insights into team output, it doesn’t capture individual performances or customer satisfaction levels.
-
Sprint Burndown
The Sprint Burndown KPI tracks the remaining work in a sprint over time, showing the team’s progress toward completing the sprint goal. It empowers the team to adjust their efforts and identify optimization opportunities. By identifying bottlenecks early, the team can proactively maintain project timelines and quality.
-
Team Capacity
Team capacity refers to the measurement of a team’s available resources during a specific period. It helps project and product managers make informed decisions about workload distribution, preventing overload and ensuring balanced assignments.
-
Cycle Time
This valuable metric measures the time taken to complete a task from start to customer delivery. It provides insights into the development process’s effectiveness, helping identify inefficiencies and streamline workflows. Cycle Time enables the team to enhance productivity and deliver high-quality software promptly.
-
Lead Time
Lead time encompasses the total time from the initial task request to its completion, including waiting periods and reviews. It offers a comprehensive understanding of the development process’s efficiency and responsiveness to customer needs. By measuring lead time, teams can identify bottlenecks and optimize their workflow for quicker deliveries.
-
Work-in-Progress (WIP)
The WIP metric monitors the number of tasks or projects the team is currently working on. It highlights bottlenecks and aids in reviewing code or managing quality control at specific stages. The team will usually set a limit on the number of in-progress tasks, this helps them focus on a limited number of tasks at a time.
Performance of a software development team
In the world of software development, measuring the performance of DevOps teams is helpful for achieving success and staying competitive. DORA metrics, coined by Google’s DevOps Research and Assessment (DORA) team, offer a comprehensive framework to assess their performance and determine where they stand on the spectrum from “low performers” to “high performers.” These four key metrics provide valuable insights into the efficiency and effectiveness of their development practices.
-
Deployment Frequency
Deployment Frequency measures how often a company successfully releases code to production. Higher-performing companies opt for more frequent but smaller deployments, sometimes up to seven times a day. This metric enables teams to find the right balance between regular releases and software stability, tailoring their approach based on the nature of the product.
-
Lead Time for Changes
Lead Time for Changes tracks the time taken for committed code to reach production. A lower lead time indicates a more efficient DevOps team in deploying code. By automating deployment and review processes, teams can reduce lead time and handle an increased number of requests seamlessly.
-
Change Failure Rate
Change Failure Rate is a true measure of software quality and stability. It calculates the percentage of changes that resulted in incidents or production failures. High-performing teams aim for a change failure rate between 0-15%, emphasizing the importance of robust testing and continuous performance improvement strategies to minimize deployment failures.
-
Time to Restore Service
Time to Restore Service measures how quickly a service bounces back from a failure. Even the most efficient teams encounter unplanned outages, but the ability to swiftly recover makes all the difference. By prioritizing recovery and establishing a response plan, DevOps teams can minimize downtime and gain a competitive advantage.
By tracking DORA metrics, DevOps and engineering leaders can get valuable insights into software delivery velocity and quality. The metrics show the progress of development endeavors, pinpoint obstacles causing slowdowns, and the reliability of deployed code. This transparency empowers leaders to make informed decisions, enhancing processes, teams, and applications. DORA metrics encapsulate the essence of performance and success, helping companies in gauging their evolution over time.

Customer satisfaction and project success Metrics
Customer satisfaction and project success metrics are useful for software development teams to gauge their performance and make data-driven decisions. Let’s explore some key metrics that provide valuable insights into customer satisfaction and project outcomes:
-
NPS (Net Promoter Score)
NPS demonstrates the likelihood of a client recommending a product or service to others. It reveals degrees of loyalty, areas for improvement, and helps reduce customer churn. Conducting periodic surveys directly with users can yield valuable feedback.
-
Customer Satisfaction Score (CSAT)
CSAT assesses end-user satisfaction by rating the software on a scale of 1 to 5 based on user experience. These assessments provide an overview of client perception and help identify and rectify potential issues.
-
Time to Market
This metric measures how quickly a product or feature is developed, tested, and delivered to customers. A shorter Time to Market leads to higher customer satisfaction and better project success, while delays may result in missed opportunities and dissatisfied customers.
-
Customer Volume
Customer Volume indicates the number of users interacting with the software. A higher volume suggests a successful and widely adopted product, leading to increased customer satisfaction and project success.
-
Customer Churn Rate
This metric reflects the percentage of customers who stop using the software over a specific period. A low churn rate signifies satisfied customers and project success, while a high rate indicates potential issues with customer satisfaction.
-
Customer Lifetime Value (CLTV)
CLTV measures the total value a customer is expected to bring to the company over their relationship with the product. A high CLTV indicates satisfied customers and contributes to project success.
-
ARR (Annual Recurring Revenue)
ARR measures the total revenue from annual subscriptions or recurring contracts with customers. A high ARR suggests satisfied customers and successful projects.
-
ROI (Return on Investment)
ROI assesses the project’s profitability relative to the initial investment. A positive ROI signifies project success and often correlates with satisfied customers.
By closely monitoring these metrics, software teams can gain valuable insights into customer satisfaction levels and project success. Continuously improving customer experience and project outcomes leads to higher retention rates, increased revenue, and sustained growth in the competitive software market.
Innovation KPIs
When it comes to measuring innovation, selecting the appropriate KPIs holds significant importance. Your chosen goals and KPIs serve as the compass guiding your actions and efforts, prompting you to align the company’s behaviors and strategies accordingly. Innovation metrics play a role in assessing the sufficiency and effectiveness of your innovation efforts. Here are a few different approaches to measuring innovation:
-
Input metrics
Input metrics help in assessing the investments you make – the “I” in ROI. These metrics offer valuable insights into various resources you allocate, whether it’s funds, time, or talent directed toward innovation-related activities. By focusing on inputs, you comprehensively understand how your resource distribution aligns with your innovation strategy. It also encompasses metrics related to the innovation process as a whole. Some simple input metrics to help you track innovation are:
-
- R&D spend as a percentage of sales
- Hours of employee time allocated to innovation exercises
- The total value of company investment in innovation
- The number of innovation projects started
- The number of new ideas in the pipeline
- Number of new employees in R&D
-
Output metrics
On the other end, output metrics, associated with the “R” in ROI, gauge the outcomes your innovation investments produce. These metrics assess the tangible results derived from your efforts and showcase whether your investments have any positive outcomes. Some output metrics that measure this are:
-
- Number of new products launched in X amount of time-
- Revenue/profit growth from new products
- ROI of innovation activities
- Actual vs. targeted breakeven time for new products
-
R&D conversion metrics
This approach combines metrics like gross margins, R&D spending, and sales from new products to comprehensively measure the innovation performance of business units.
The first key metric, R&D-to-product (RDP) conversion, is derived by assessing the ratio of R&D spending to sales generated by new products. This metric allows you to closely monitor how your investment in research and development translates into tangible sales from innovative products.
The second important metric, new-products-to-margin (NPM) conversion, takes into account the ratio of gross margin percentage to sales from new products. This metric highlights the extent to which new product sales contribute to an uplift in overall margins.
By employing both RDP and NPM metrics in tandem, innovation managers gain a complete set of straightforward yet highly effective ROI measurements. These metrics provide a holistic view of innovation’s true value, considering both input and output variables.

Transform Your Ideas into Reality with Future Code’s Software Development! Partner with Future Code’s expert developers to create innovative, scalable, and robust software tailored to your business needs.
Tools to Track KPIs in Software Development
With the introduction of these KPIs you may be asking, ‘How do I track them in the first place’? Here are some performance monitoring tools to help you make the best out of your KPIs.
Popular tools and software that aid in tracking and analyzing KPI data
Tracking and analyzing KPIs helps businesses to measure their success and make informed decisions. Luckily, there are many powerful tools and software available to aid in this process.
- Geckoboard is a live KPI tracking dashboard that allows businesses to design custom visual dashboards with a drag-and-drop interface. It integrates with popular software like Google Analytics and Salesforce.
- Salesforce is a customizable CRM software with a range of features and third-party integrations, ideal for growing businesses.
- Grow is a business intelligence software development KPI dashboard and reporting software that helps businesses grow faster by integrating data from various sources.
- Tableau is designed for retail and e-commerce operations, offering real-time data blending and informative insights.
- Olation provides easy mapping of relational structures and data communication between systems, streamlining application development.
- SimpleKPI is a user-friendly tool that can track various types of metrics and offers 24/7 support.
- Scoro is a KPI dashboard software that allows businesses to monitor their performance in real-time.
- Asana offers project-based KPI tracking tools and OKR for task and objective management.
- Datapine provides a self-service software development analytics platform that empowers every team member to generate actionable insights.
- iDoneThis offers easy onboarding and a minimalist design, enabling users to log goals and track progress.
- Moz Pro is an all-in-one SEO toolset to improve a business website’s SEO.
- Splash is a tool to create, manage, and execute events that help businesses grow and engage with their audience.
- HubSpot is an all-in-one CRM platform that connects marketing, sales, and customer service.
- The old-school spreadsheet remains a versatile tool for data filtering, visualization, accounting, analytics, and more.
With these powerful tools, businesses can effectively track and analyze their KPI data, leading to better decision-making and overall success.

Advantages of using specialized KPI tracking solutions in software development
Specialized KPI tracking solutions in software development offer significant advantages for businesses. They allow companies to track progress toward goals, measure performance, and make informed decisions. By combining various key performance metrics in a dashboard, businesses can identify issues and capitalize on opportunities effectively.
KPIs serve as a company’s scorecard, providing essential insights into its overall health and performance. By measuring key indicators for employees, customers, processes, and revenue, businesses gain valuable insights. Assigning accountability to specific individuals ensures the right areas are measured and improved upon.
Moreover, KPIs foster accountability among employees, empowering them to take ownership of their work and strive for better performance. In the dynamic software industry, utilizing specialized KPI tracking solutions is vital for staying focused, addressing challenges, seizing opportunities, and driving growth and success.
Conclusion
Overall, key performance indicators software development is crucial for measuring project success and driving continuous improvement. Metrics and KPIs provide insights into development processes, code quality, and team performance, enabling progress tracking and identifying areas for improvement. Strategic KPI selection aligns with organizational objectives, ensuring projects meet goals. Embracing relevant KPIs fosters a culture of improvement, leading to high-quality software products and satisfied stakeholders. By utilizing Software Development KPIs, teams can exceed expectations and stay ahead in the rapidly evolving software industry.
Find some time in your calendar and schedule an online appointment.
Make an appointment

